The Purpose of Measurement
There are many reasons why businesses and organizations decide to measure performance when it comes to their digital marketing. Some are looking for specific insight into their marketing efforts, like pay per click, to optimize for performance, while others are looking to get an idea of what their audience attributes are. There’s no wrong answer in terms of why digital marketing analytics is essential.
That said, the things that happen after you start to measure is much more fulfilling. New ideas for product and content, user trends (both positive and negative), content trends, audience attributes, audience segments, user behavior across website properties and sometimes offline activities as well, sales data, social media engagement, attribution, and other actionable insights are amongst the most common.
Data Warehousing & Data Visualization
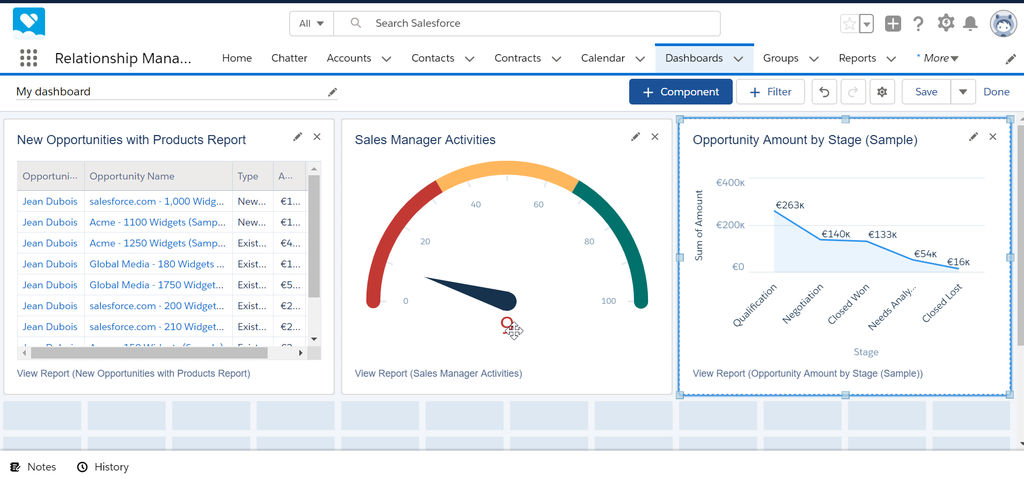
These are two standard terms used within the industry. Data Warehousing is the storage of large amounts of data for analysis. Data Visualization, or Dash-boarding, is the practice of using said stored data to create visual representations that everyday users and stakeholders can use to take the temperature of all things that are measured. These Dashboards often have multiple slides, or cards, that each visualizes a portion of the data.
There are different platforms of warehouse data that we use every day but may not think of them as such. These include Dropbox, Google Drive, and iCloud Drive to name a few. Not all of them, however, store the data in a way that integrates with other platforms.
We tend to use Google Drive to store data because it makes the integration with Google Data Studio, a free Data Visualization platform, and a seamless one.
How to Approach the Data
When dealing with large sets of data, or data sets, it is essential to remember what questions you are looking to get answered by the data. No one dataset or visualization will contain all of your answers. No one group of fields, categories, pivot tables, or filters will massage the data to the point of providing you with all the solutions. Take each data set with a grain of salt and keep in mind that it is a part of a much larger picture; see the forest for the trees.
That said, each data set will tell you its own story. You will identify trends, create new questions, and make inferences based on the data. We encourage you to analyze the data, make a hypothesis, and then pull the levers to improve upon the desired result. There will be more about this in our optimization section.
Happy measuring! Subscribe to our newsletter for more on digital marketing analytics and more.


